fig = plt.figure()
# linker plot
ax = fig.add_subplot(121)
plt.xlim([0, 5])# hier habe ich 5 gewählt weil das auf dem foto so etwa 5-geteilt aussieht
plt.ylim([0, 5])
ax.set_aspect('equal')
#ax.set_axis_off()
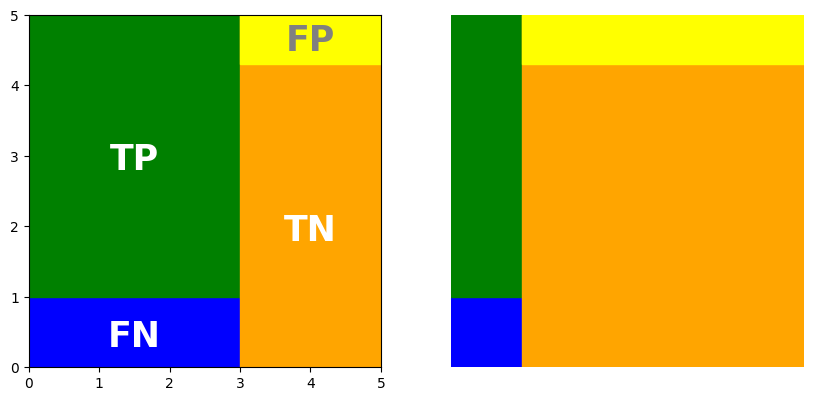
# das sind die quadrate, hier farbe ändern
rect1 = matplotlib.patches.Rectangle((0,0), 3, 1, color='blue')
rect2 = matplotlib.patches.Rectangle((0,1), 3, 4, color='green')
rect3 = matplotlib.patches.Rectangle((3,0), 2, 5.3, color='orange')
rect4 = matplotlib.patches.Rectangle((3,4.3), 2, 0.7, color='yellow')
# rechtecke dem plot hinzufügen
for rectangle in [rect1,rect2,rect3,rect4]:
ax.add_patch(rectangle)
#text?
ax.text(1.5,0.3,'FN',horizontalalignment ='center', fontsize = 25, color ='white',weight="bold")
ax.text(1.5,2.8,'TP',horizontalalignment ='center', fontsize = 25, color ='white',weight="bold")
ax.text(4,4.5,'FP',horizontalalignment ='center', fontsize = 25, color ='grey',weight="bold")
ax.text(4,1.8,'TN',horizontalalignment ='center', fontsize = 25, color ='white',weight="bold")
# rechter plot
ax = fig.add_subplot(122)
plt.xlim([0, 5])
plt.ylim([0, 5])
ax.set_aspect('equal')
ax.set_axis_off()
rect1 = matplotlib.patches.Rectangle((0,0), 1, 1, color='blue')
rect2 = matplotlib.patches.Rectangle((0,1), 1, 4, color='green')
rect3 = matplotlib.patches.Rectangle((1,0), 4, 5.3, color='orange')
rect4 = matplotlib.patches.Rectangle((1,4.3), 4, 0.7, color='yellow')
for rectangle in [rect1,rect2,rect3,rect4]:
ax.add_patch(rectangle)
plt.show()
# plt.savefig('confusion_matrix.png',dpi=300, bbox_inches = 'tight')